News
Imagining the Impact of a Hard Landing in China
Thoughtful stress-testing gives you the ability to evaluate the impact of potential market scenarios on your portfolios, or on a specific subset of positions. A scenario can be based on historical market events, (such as the Global Financial Crisis), or hypothetical events – set up to provide insight into portfolio risk under anticipated, best-case or worst-case future market conditions.
As China confronts numerous internal and external challenges from slowing economic growth, disruption in Hong Kong and a volatile trade conflict with the United States, it may be prudent to assess and understand the risk a hard landing for the Chinese economy may pose to your portfolio.
| Moderate Slowdown | Hard Landing | |
| Chinese Yuan | -5% | -9% |
| Mainland Equities | -15% | -30% |
| Hong Kong Equities | -10% | -25% |
| MSCI Emerging Markets Index | -10% | -25% |
| US Equities | -5% | -15% |
| US Dollar Index | 3% | 5% |
| US Bond Prices | 3% | 5% |
| Gold | 3% | 7% |
The scenarios below attempt to capture the potential impact of either a moderate slowdown or hard landing for the Chinese economy on select asset classes, incorporating both a risk-off sentiment towards Chinese equities and risk assets as well as a flight to safety towards the US dollar, US treasuries and gold.
The highly customizable nature of TS Imagine’s stress-testing scenarios allows you to create scenarios specifically tailored to your own risk monitoring priorities and market expectations. TS Imagine’s scenarios evaluate the performance of your positions under each scenario, analyzing the historical relationship between the shocked asset class and each holding in your portfolio.
Portfolio View
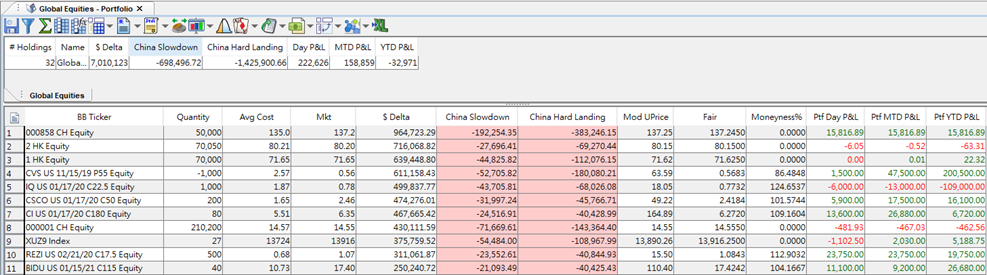
In addition to viewing position-by-position results and portfolio totals, you can aggregate positions by parameters such as Industry or Currency to display meaningful breakdowns of the stress-test results.
The examples below leverage ‘View-By’ templates that allow for quick toggling between aggregation criteria, making it easier to examine exposures and identify sources of risk within a portfolio. From here, you can drill into specific industries or currencies to see the contribution of each constituent position.
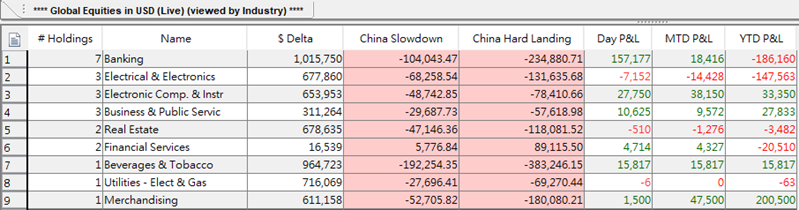
Aggregation by Industry
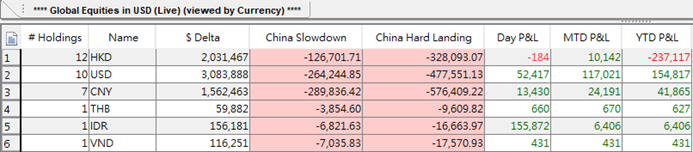
Aggregation by Currency
Please contact Consulting or your TS Imagine representative for help with constructing your own scenario analysis.
Disclaimer
The stresses described in this blog post illustrate one possible scenario and are intended to be used in general as guidance towards risk management of market events.

Andrew Jay works as a consultant in TS Imagine’s Hong Kong office, working on APAC client implementations and customization projects. Andrew holds a bachelor’s degree from the University of Miami and Masters degrees from The Hong Kong Polytechnic University and Antwerp Management School. He can be reached by email and by phone at 852-3929-2233
Related News
Warning: Undefined variable $postId in /home/kraus/samplesite2/wp-content/themes/imaginesoftware/page-templates/part-newsentry.php on line 70
/ Risk Management
White Paper:
Predicting the Past
Historical VaR (HVaR) has become a standard measurement of risk. Many firms now require a full twelve years of prices (plus data from further back such as the Great Recession of 2008–2009). However, this requirement introduces a conundrum: what do we do when a company has not been around for a full twelve years?

Warning: Undefined variable $postId in /home/kraus/samplesite2/wp-content/themes/imaginesoftware/page-templates/part-newsentry.php on line 70
/ Risk Management
Chartis RiskTech BuySide 50 report: TS Imagine wins Technology and Techniques Category
TS Imagine is proud to announce that we have been ranked no 1 in the Technology and Techniques category by Chartis Research in the Chartis RiskTech Buyside 50 report.
Warning: Undefined variable $postId in /home/kraus/samplesite2/wp-content/themes/imaginesoftware/page-templates/part-newsentry.php on line 70
/ Risk Management
Enriching the HVaR Calculation:
Predicting the Past:
HVaR, By Dr Lance Smith, Chief Strategy Officer, TS Imagine Historical VaR (HVaR) has become a standard measurement of risk, in which a current portfolio is subjected to the market conditions of a prior day and the resulting P&L is recorded. Read entire article here.