News
Election Follow-up: Probability-Weighting Forecasts
The result of the United States presidential election last week delivered more than just a surprising new Commander in Chief–the markets surprised, too. Initial reactions to the news that Donald Trump was the likely winner at approximately 1:00 EST shocked markets and crushed risk appetite – much as many had expected. Risk was immediately dumped in favor of the usual havens, including gold and CHF, and equity vol jumped more than 20 percent in the early hours. But, as time wore on, prices settled and liquidity improved. As the opening bell rang Friday morning, we were witness to far-reaching reversals as stocks pared losses and pushed on to making strong gains by the end of the day.
Below I illustrate the extent to which markets moved from initial reactions to twelve hours following:
| Forecast | ||
| Probability (approx.) | 0.8 | 0.2 |
| Asset Class | Clinton Wins | Trump Wins |
| USDCHF | 2% | -4% |
| US Bond Prices | -1% | 2% |
| US Equities | 1% | -3% |
| Gold | -1% | 5% |
| Volatility | -5% | 20% |
| Initial Reaction | Change on close (01.00 ET) | Forecast |
| USDCHF | -2.0% | -4% |
| US Bond Prices | 0.4% | 2% |
| US Equities | -3.7% | -3% |
| Gold | 3.9% | 5% |
| Volatility | 19.0% | 20% |
| 12hrs Later | Change on prev. close (13.00 ET) | 12hr Change (% Points) |
| USDCHF | 0.5% | 2.5% |
| US Bond Prices | -2.3% | -2.7% |
| US Equities | 1.0% | 4.7% |
| Gold | 0.1% | -3.8% |
| Volatility | -2.2% | -21.2% |
The above table captures the potential nature of event risk outcomes–limit down one moment to unch and then higher within hours. What is crucial to note here is the biggest movement of capital happened sometime after information was known, not as it was known, like many are more familiar.
Below is an example of how clients can assign probabilities to forecasts, which in turn allows for an overall estimated expectation of event outcomes:
Aggregated by Strategy
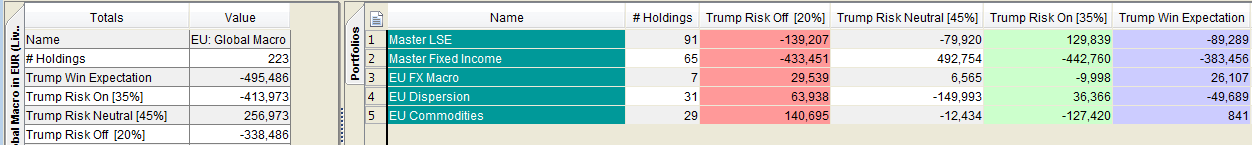
Strategy drill-down
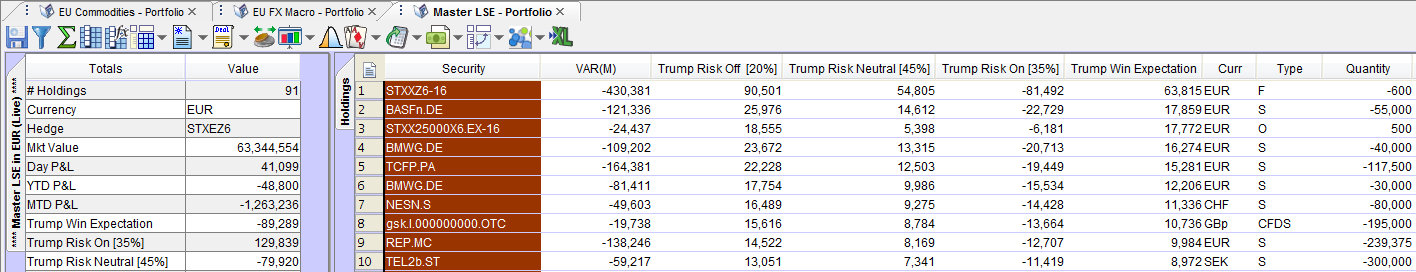
Being fortunate to predict an initial reaction matters if exposure to prices stops there–the reality can be markedly different.

David White worked as an equity trader and portfolio manager in derivatives for more than five years before joining TS Imagine’s London office as a Consultant in 2015. David’s roles are to advise and offer consulting services for systematic applications of risk management and derivatives pricing. David leads and is the project manager for EMEA client implementations. David holds a bachelor’s degree from Bournemouth University. He can be reached by email and phone: +44 (0) 7440 0743.
Related News
Warning: Undefined variable $postId in /home/kraus/samplesite2/wp-content/themes/imaginesoftware/page-templates/part-newsentry.php on line 70
/ Risk Management
White Paper:
Predicting the Past
Historical VaR (HVaR) has become a standard measurement of risk. Many firms now require a full twelve years of prices (plus data from further back such as the Great Recession of 2008–2009). However, this requirement introduces a conundrum: what do we do when a company has not been around for a full twelve years?

Warning: Undefined variable $postId in /home/kraus/samplesite2/wp-content/themes/imaginesoftware/page-templates/part-newsentry.php on line 70
/ Risk Management
Chartis RiskTech BuySide 50 report: TS Imagine wins Technology and Techniques Category
TS Imagine is proud to announce that we have been ranked no 1 in the Technology and Techniques category by Chartis Research in the Chartis RiskTech Buyside 50 report.

Warning: Undefined variable $postId in /home/kraus/samplesite2/wp-content/themes/imaginesoftware/page-templates/part-newsentry.php on line 70
/ Risk Management
Enriching the HVaR Calculation:
Predicting the Past:
HVaR, By Dr Lance Smith, Chief Strategy Officer, TS Imagine Historical VaR (HVaR) has become a standard measurement of risk, in which a current portfolio is subjected to the market conditions of a prior day and the resulting P&L is recorded. Read entire article here.